Create Your First Project
Start adding your projects to your portfolio. Click on "Manage Projects" to get started
Business Intelligence (Dashboard about OTT Media Data)
Project type
Interactive Dashboard, Business Intelligence, Data Science
Location
Sintok, Kedah
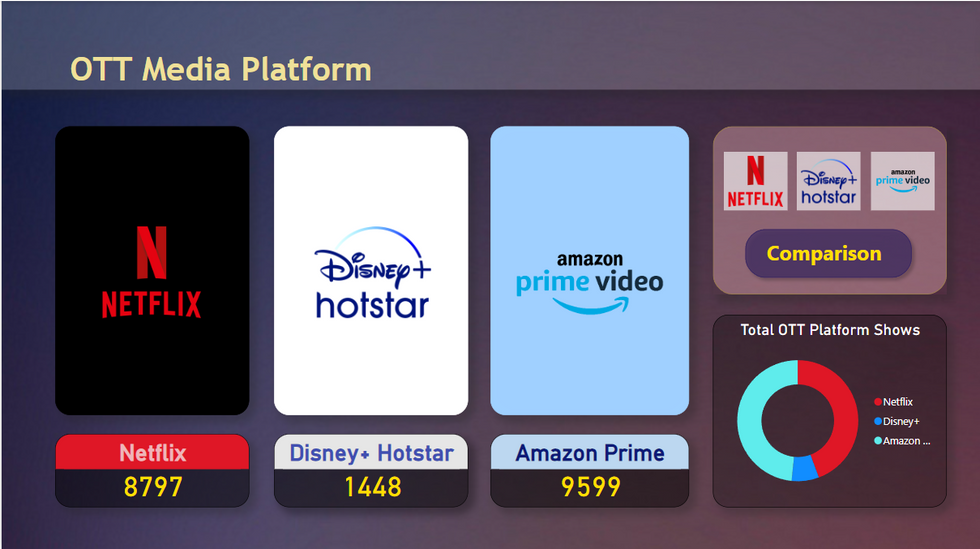
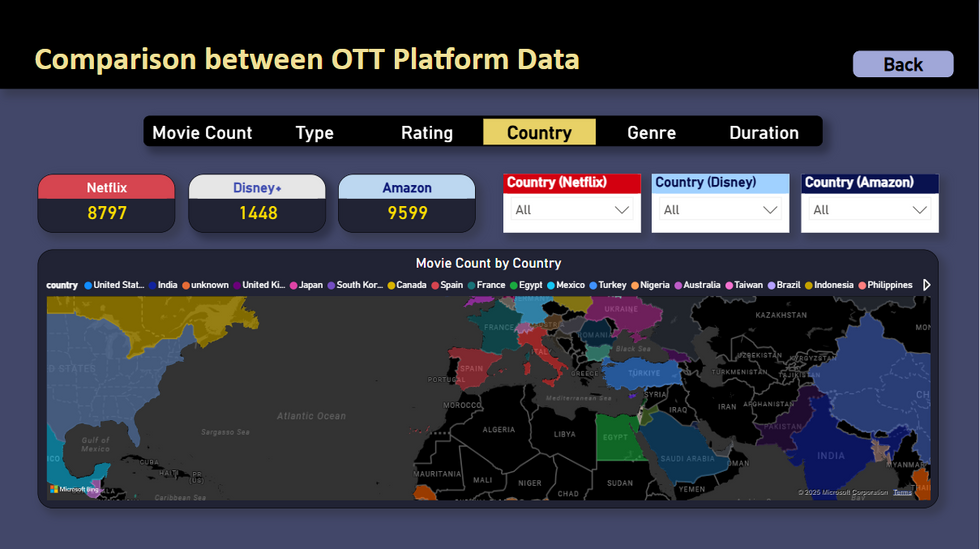
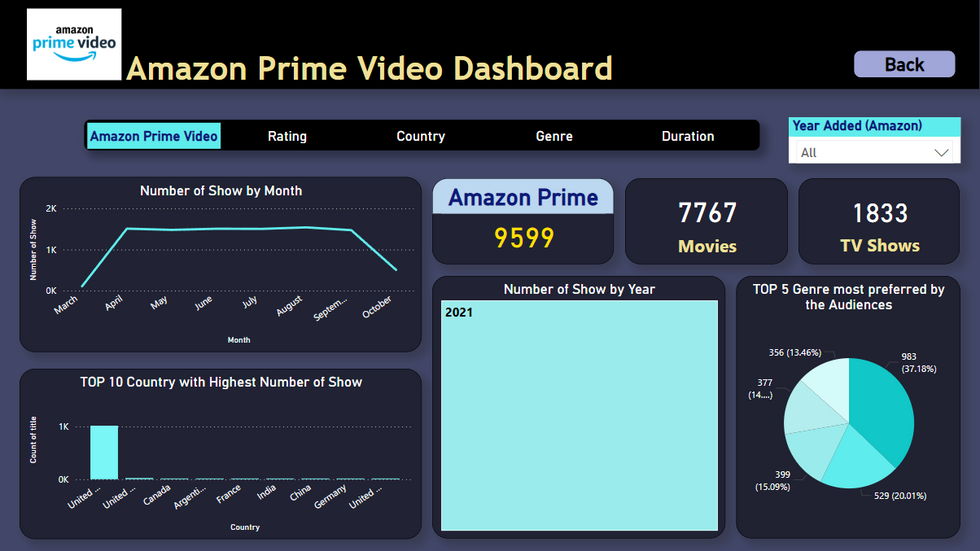
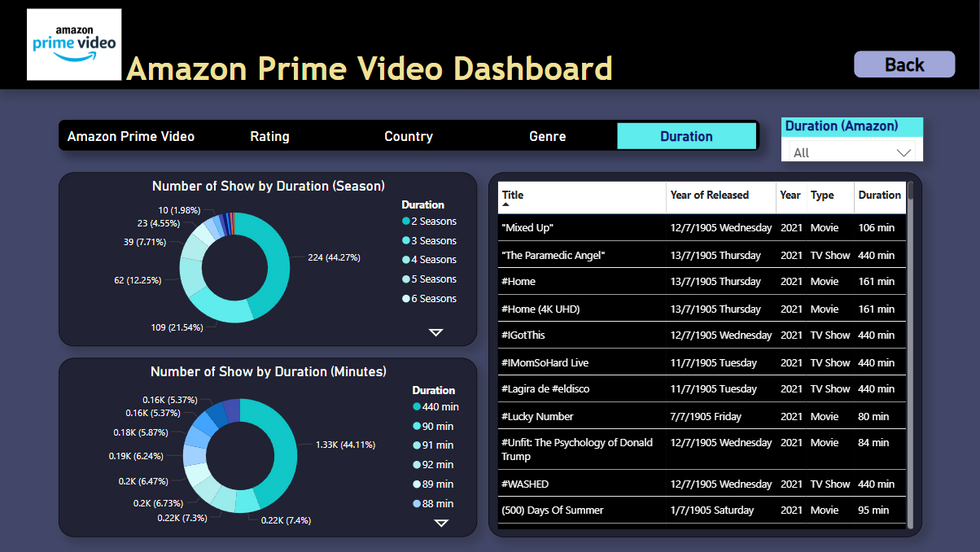
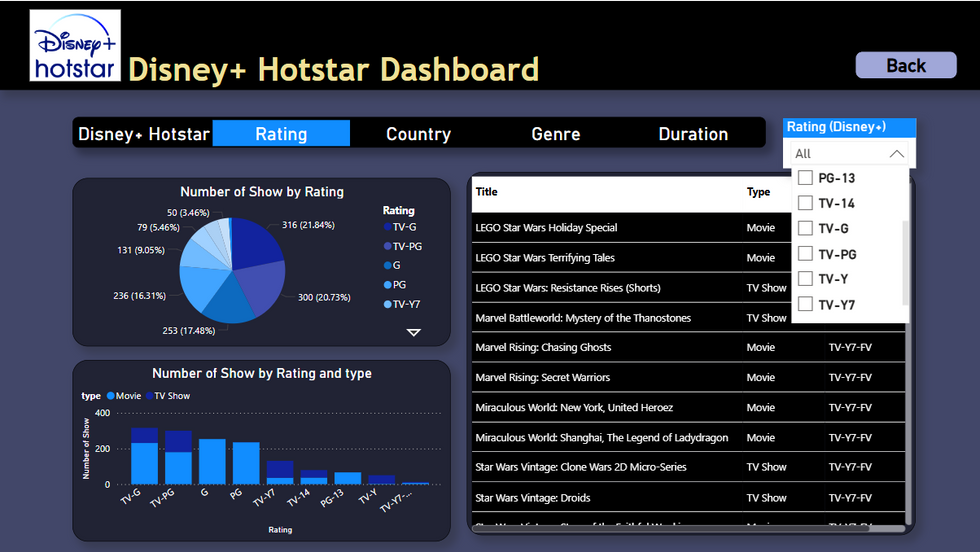
📱This is a group project for the Business Intelligence course, where we analyzed OTT media platform data from Netflix, Disney+, and Amazon Prime Video. The data is visualized in an interactive dashboard to provide insights into content trends, platform comparisons, and audience preferences.
📱Power Query in Microsoft Power BI was used for data preprocessing, including cleaning missing values, transforming data formats, and aggregating data for deeper analysis.
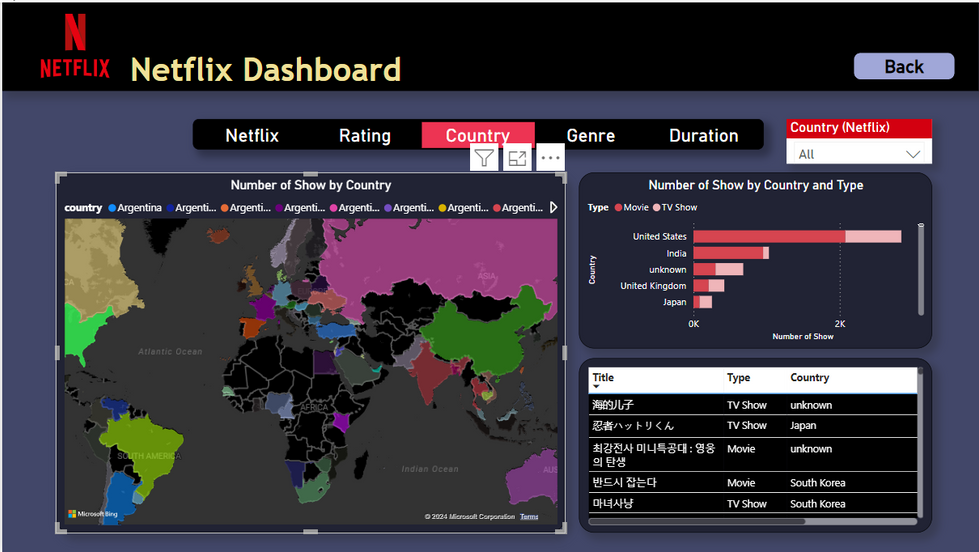
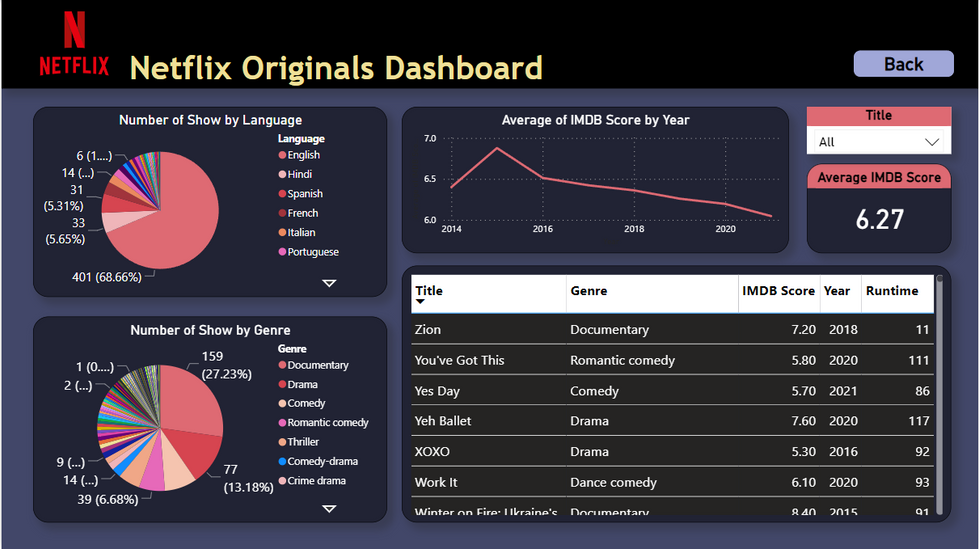
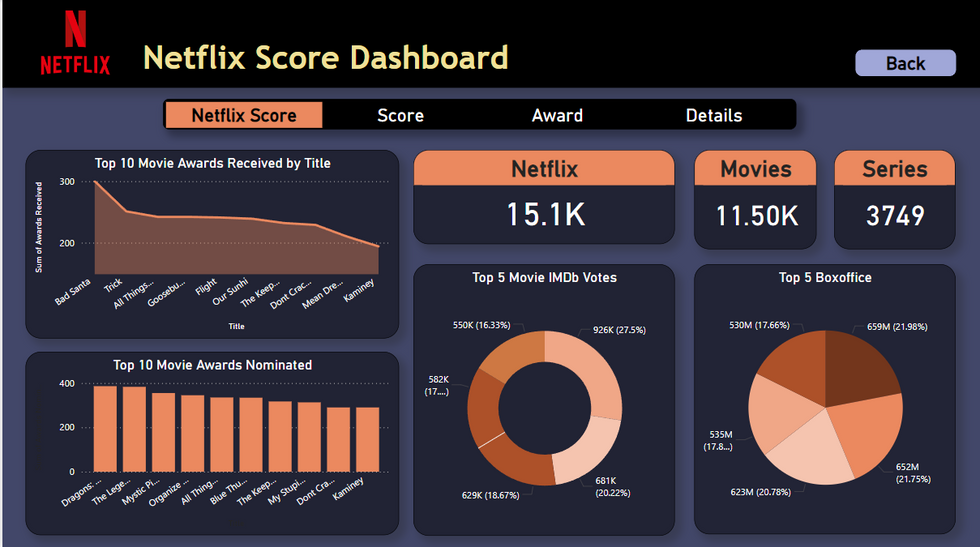
📱Power BI visualization tools were utilized to design a dynamic and user-friendly dashboard. The dashboard includes insights on ratings, country, genre, duration, date released, award, and various scores such as IMDb and Rotten Tomatoes.
📱This project demonstrates how Business Intelligence techniques can turn raw OTT media data into clear, actionable insights, enabling better decision-making in the streaming industry.
In collaboration with:
1. Lee Qi Zun
2. Lee Kien Soon
3. Yap Jia Jun

